
Painting Munich, One Tile at a Time
Two attempts, one duplicated town hall and about two dollars of image generation.
A few weeks ago I saw isometric.nyc by Andy Coenen, a giant isometric map of New York where every block looks like it was painted for a city-builder game. You can zoom from the whole of Manhattan down to a single fire escape, and it never stops looking like a game. Shortly after, someone showed me Tiny València by @13ug1mb, the same idea applied to 112 km² of Valencia, with balconies, terracotta roofs and the Plaza Redonda perfectly recognisable.
The obvious question was: how difficult would be to do the same for Munich, with the tools that are available today to a single person on a weekday evening?
This article explains the whole process. I tried two completely different approaches, made one mistake that is worth explaining in detail, and ended up with a small pilot of the city centre that I am quite happy with. I built it together with Claude Code, which wrote most of the code while I was making decisions, looking at screenshots and paying the bills. It also includes how much it did cost, which is less than you probably think.
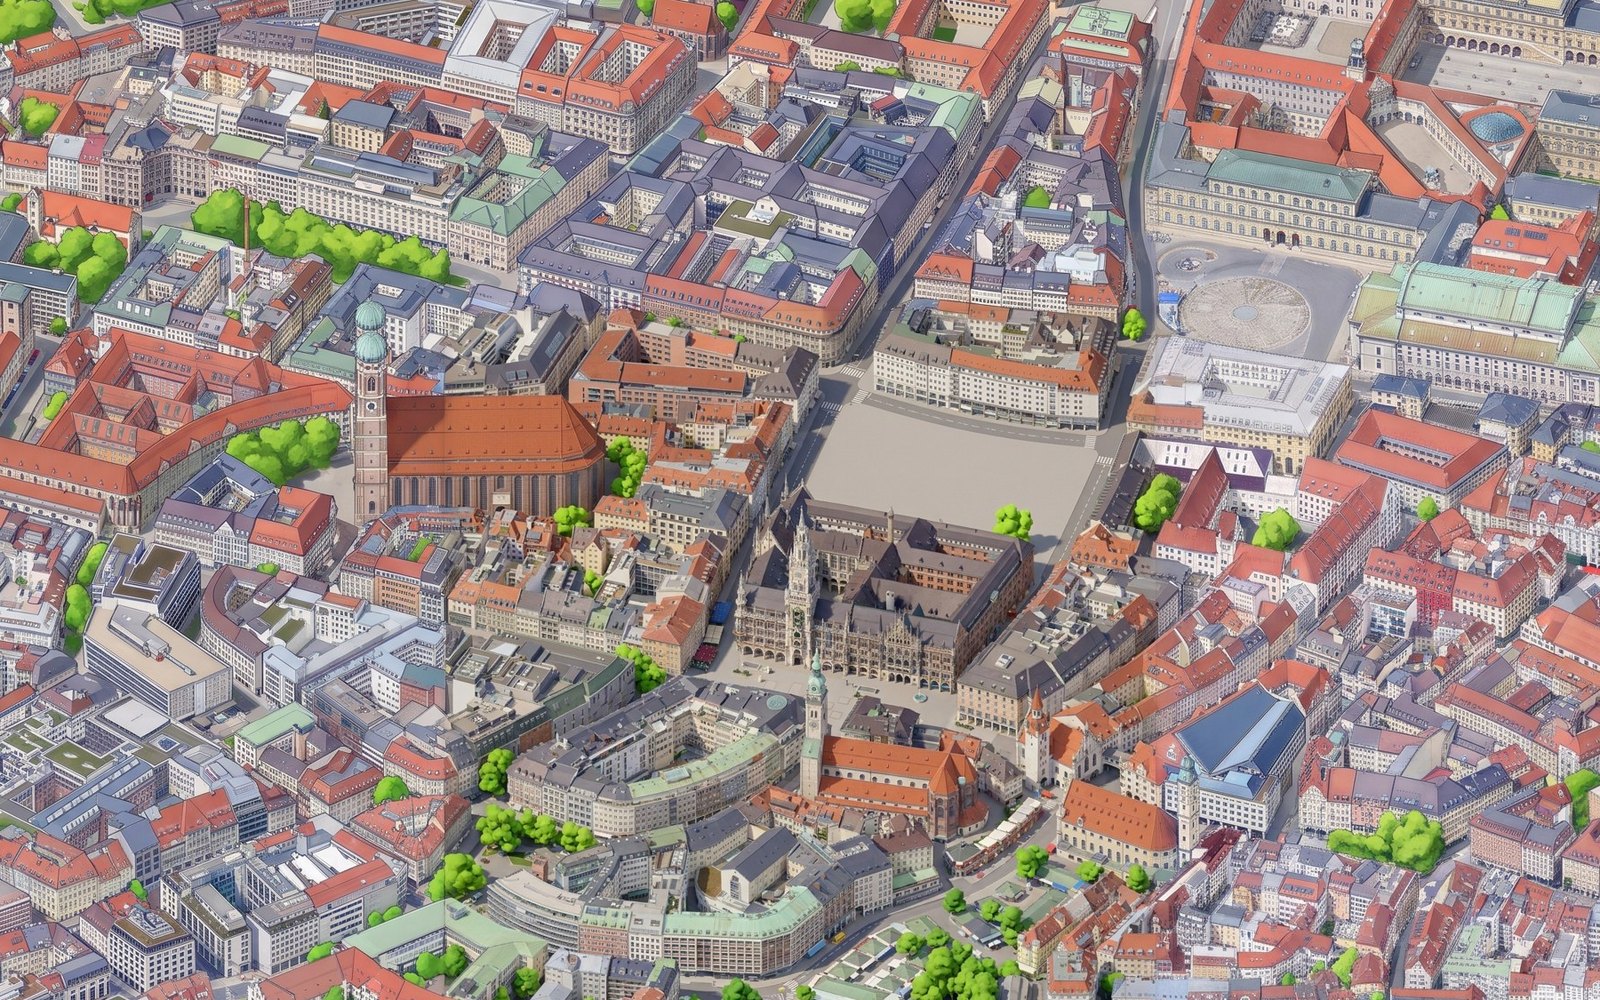
Marienplatz, the Frauenkirche and the Residenz, as they look in the final version.
What isometric.nyc actually does
Before writing a single line of code, it is worth to understand how the original was made, because the obvious answer (“someone drew it”) is wrong, and the second obvious answer (“an AI drew it”) is only half right.
Andy started with 3D building data of New York and quickly found that it did not match the satellite imagery well enough. What finally worked was Google’s Photorealistic 3D Tiles: the photogrammetry mesh that powers the 3D view of Google Earth, available through the Google Maps Platform. It contains precise geometry and real textures in one renderer. He rendered those tiles from a fixed isometric camera, one square at a time, and obtained something like a very detailed, slightly ugly aerial photo of the whole city.
The painting is the AI part. He first tried Nano Banana Pro with reference images, but it was too slow, too expensive for tens of thousands of tiles and inconsistent in style. So he fine-tuned an open model, Qwen-Image-Edit, with around 40 pairs of input render and hand-picked painted output, and ran it on a rented H100. The final map is served with OpenSeadragon, the same deep zoom library many museums use for their high resolution scans. The details are in his write-up, and it is a fantastic read.
So the recipe has three ingredients: geometry with textures, a model that turns photos into illustrations, and a tiled viewer. I wanted to see how far I could get with the first one replaced by something open.
Attempt one: OpenStreetMap and three.js
The first idea was to avoid AI completely. OpenStreetMap has a very good coverage of Munich, and many buildings in the city centre are tagged with their height, their number of levels and even the shape of their roof. If the data is good enough, a procedural renderer might get surprisingly close.
The data comes from the Overpass API with a single query. The bounding box covers roughly 4.8 by 4 km, from the Theresienwiese in the west to the Englischer Garten in the east:
[out:json][timeout:180];
(
  way["building"](48.122,11.540,48.158,11.605);
  relation["building"](48.122,11.540,48.158,11.605);
  way["building:part"](48.122,11.540,48.158,11.605);
  way["highway"](48.122,11.540,48.158,11.605);
  way["railway"~"rail|tram|light_rail|subway"](48.122,11.540,48.158,11.605);
  way["natural"~"water|wood|scrub"](48.122,11.540,48.158,11.605);
  way["leisure"~"park|garden|pitch|playground"](48.122,11.540,48.158,11.605);
  ...
);
out geom;
That returns 31 MB of JSON. A Python script projects every coordinate to metres around Marienplatz, rounds them to 10 centimetres and writes a compact scene of 4.7 MB. Most of the work in that script is dealing with the fun parts of OpenStreetMap:
- Multipolygons. Big buildings and the Isar are relations made of several open ways that have to be stitched together into closed rings, with inner rings for courtyards.
- Building parts. Landmarks like the Frauenkirche are modelled as one outline plus many
building:partshapes with their own heights. If you render both, the outline swallows the detail, so the script drops every outline that contains a part. That removed 384 outlines. - Missing heights. When there is no
heighttag, the script usesbuilding:levelstimes 3.3 metres, and if that is missing too, a default per building type: 9 metres for a house, 3 for a garage, 25 for a church.
The final scene has 16,611 buildings, 16,234 streets and paths, 770 railway and tram lines and 2,191 areas of water, parks and squares.
The viewer is a single page with three.js. An orthographic camera at the classic 2:1 angle of pixel-art games (an elevation of atan(0.5), around 26.6 degrees) renders the scene into a render target at half of the screen resolution. A post-processing shader then scales it up with nearest-neighbour filtering, which gives you the chunky pixels, and adds two things: a slight reduction of the palette, and one-pixel dark outlines wherever the depth changes abruptly. That last bit is what makes it look drawn instead of rendered:
float d  = texture2D(tDepth, vUv).r;
float dl = texture2D(tDepth, vUv - vec2(texel.x, 0.0)).r;
float dr = texture2D(tDepth, vUv + vec2(texel.x, 0.0)).r;
float du = texture2D(tDepth, vUv + vec2(0.0, texel.y)).r;
float dd = texture2D(tDepth, vUv - vec2(0.0, texel.y)).r;
// Darken the near side of any depth discontinuity: crisp 1px outlines.
float edge = step(outline, max(max(dl - d, dr - d), max(du - d, dd - d)));
vec3 col = c.rgb * mix(1.0, 0.55, edge);
The threshold had to depend on the zoom level. When you zoom out, two neighbouring pixels of flat ground are several metres apart in depth, and a fixed threshold paints the whole city black. Another small detail that makes a big difference: the camera position is snapped to whole pixels of the render target, otherwise every building shimmers when you drag the map.
Windows are not geometry. Every wall carries its position along the façade and its height as a vertex attribute, and the fragment shader draws a window every 3.2 metres horizontally and every floor of 3.3 metres, with a random tint per window. Since I had the windows anyway, a night mode where around half of them light up in warm yellow was almost free. Trees are scattered randomly inside parks and forests, with a spatial hash of building footprints to make sure no tree grows inside a house. A short list of places lets you fly to Marienplatz, the Hofbräuhaus or the Deutsches Museum.
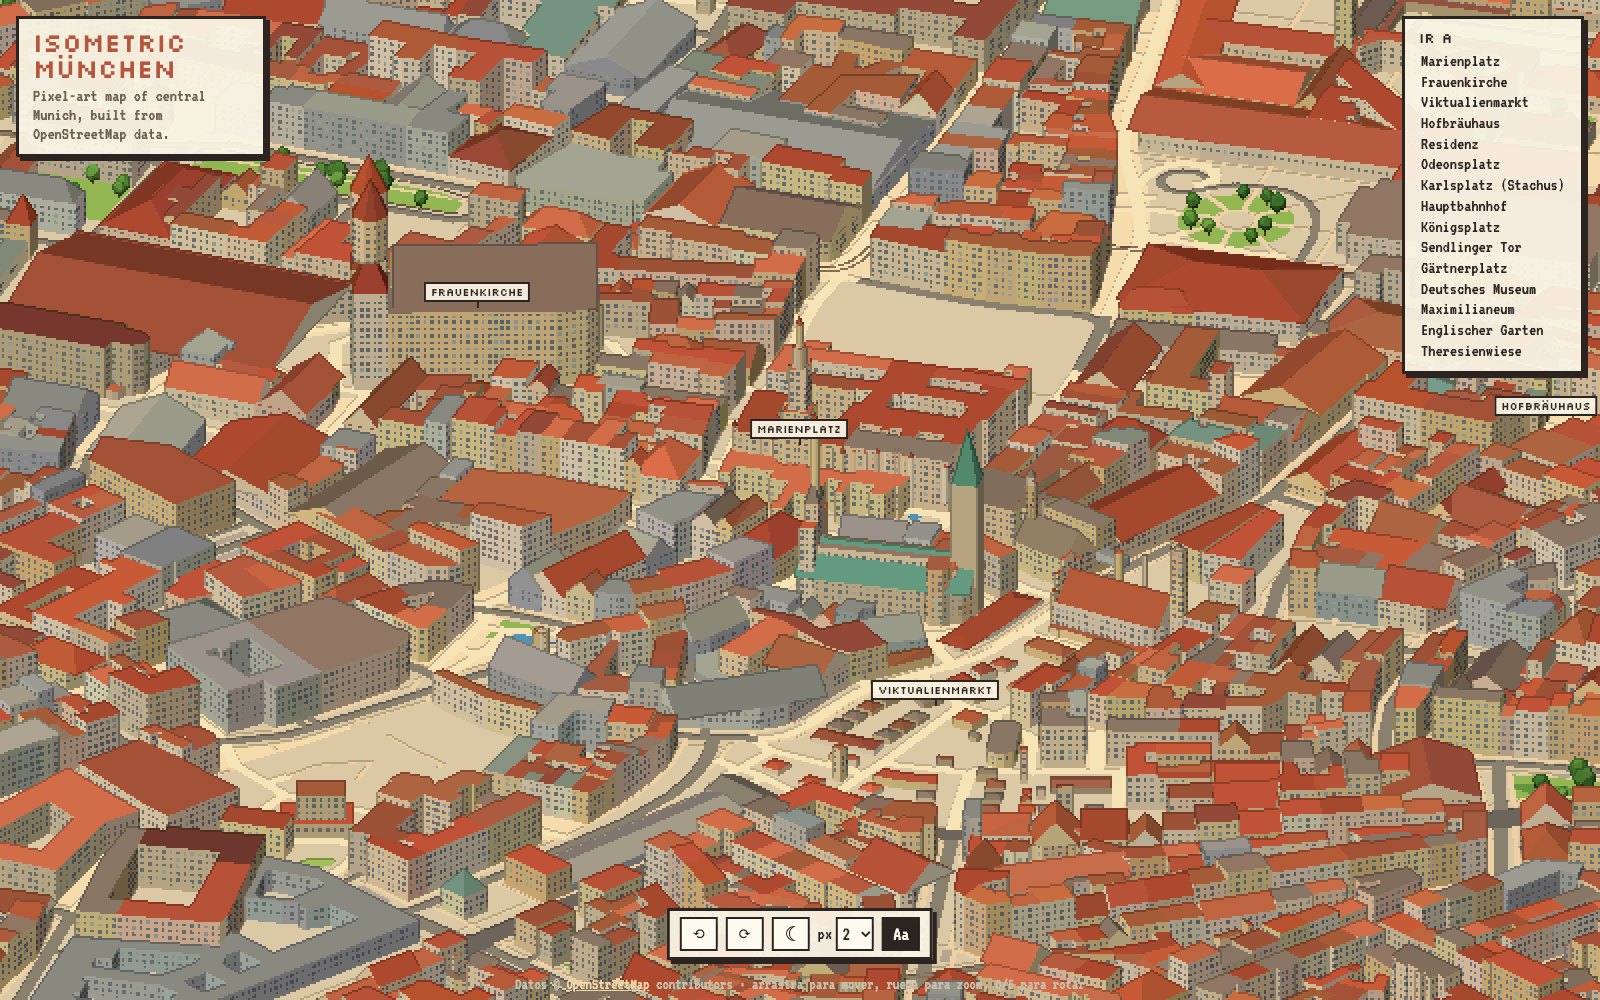
The OpenStreetMap version, with north at the top.
One decision I made after the first screenshot was to put north at the top. The classic isometric diamond, looking from the south-east, shows two façades of every building and looks more like a game, but it makes the map hard to read for anybody who knows the city. With north up you mostly see south-facing façades, which is a fair price to pay for recognising your own street.
Two churches, a hundred metres tall
It worked rather soon, with one funny bug. Two enormous blocks were towering over the Altstadt, more than three times higher than anything around them. It turned out that St. Peter, the church next to Marienplatz, has a height of 91 metres in OpenStreetMap. That is the height of its tower, but it is applied to the whole footprint of the church, so the renderer happily extruded a 91 metre high box. The nave of the Frauenkirche had a similar problem: a single part of 60 metres with a gabled roof, which my code rendered as a flat-topped box.
Both are reasonable tags in OpenStreetMap, they are just not meant to be extruded naively. The fix was two heuristics. When a church has a height above 40 metres and a large footprint, the nave gets a sensible height and a separate square tower with a spire is placed at one end of the building. And gabled or hipped roofs on complex footprints are now built on the oriented bounding box of the footprint, which for long buildings like a nave looks surprisingly right.
The result is nice, but it is a diagram of Munich, not a painting. OpenStreetMap knows where a building is and how tall it is, but it does not know the colour of its façade, where the balconies are, or that the Neues Rathaus is a neo-gothic wedding cake. No amount of shader tricks gets you to the level of detail of Tiny València from footprints alone. For that, you need pixels that come from the real city.
Attempt two: Google Photorealistic 3D Tiles
The setup on the Google side is short, but there are a couple of steps. You need a project in Google Cloud with billing enabled, the Map Tiles API activated, and an API key. Since the key ends up in a web page, it is a good idea to restrict it to the Map Tiles API and to the URL where your page runs. The usage of the pilot fits easily in the free monthly quota.
To render the tiles I used 3d-tiles-renderer, the library from NASA’s AMMOS team that is pretty much the standard for 3D Tiles in three.js. It needs three plugins: one for Google authentication, one for glTF extensions with a Draco decoder (Google compresses the meshes), and one to move the planet so that the area you care about sits at the origin:
const tiles = new TilesRenderer();
tiles.registerPlugin(new GoogleCloudAuthPlugin({ apiToken: GOOGLE_MAPS_API_KEY, autoRefreshToken: true }));
tiles.registerPlugin(new GLTFExtensionsPlugin({ dracoLoader: draco }));
tiles.registerPlugin(new TileCompressionPlugin());
tiles.registerPlugin(new ReorientationPlugin({
  lat: THREE.MathUtils.degToRad(48.1374),
  lon: THREE.MathUtils.degToRad(11.5755),
  height: 566,
  recenter: true,
}));
tiles.errorTarget = 2;
The tiles are stored in Earth-centred coordinates, millions of metres away from the origin, which is a recipe for floating point problems. After the ReorientationPlugin, Marienplatz is at (0, 0, 0), Y points up, Z points north and X points west. The height is the ellipsoid height of the street level, around 520 metres above sea level plus 47 metres of geoid in Munich. The errorTarget controls how detailed the loaded tiles are: lower means sharper and more downloads.
The camera is orthographic, looking north at 35 degrees, slightly steeper than the OpenStreetMap version because photogrammetry looks bad when you see too much of the walls. Every capture is a square of 1024 pixels at 0.3 metres per pixel, around 307 metres wide. The important detail is how the grid is defined. Instead of moving the camera over a grid on the ground, it moves over a grid in the plane of the camera:
function placeCamera(col, row) {
  const center = new THREE.Vector3()
    .addScaledVector(right, col * TILE_WORLD)
    .addScaledVector(up, -row * TILE_WORLD);
  camera.position.copy(center).addScaledVector(forward, -DIST);
  camera.lookAt(center);
}
That way every tile is literally a piece of one single huge orthographic image, and neighbouring tiles fit together pixel by pixel, including tall buildings that would otherwise be cut differently in each tile.
The capture runs in headless Chrome, driven by Playwright. The page exposes a captureTile function: it moves the camera, calls tiles.update() every frame, and only takes the screenshot when nothing has been downloading or parsing for 20 consecutive frames. Each tile takes around 10 seconds. For the pilot I captured a grid of 3 by 3 tiles around Marienplatz, about 920 metres on each side. The same page also works as an interactive viewer when you open it in a normal browser, which was very useful to choose the angle and the scale before capturing anything.
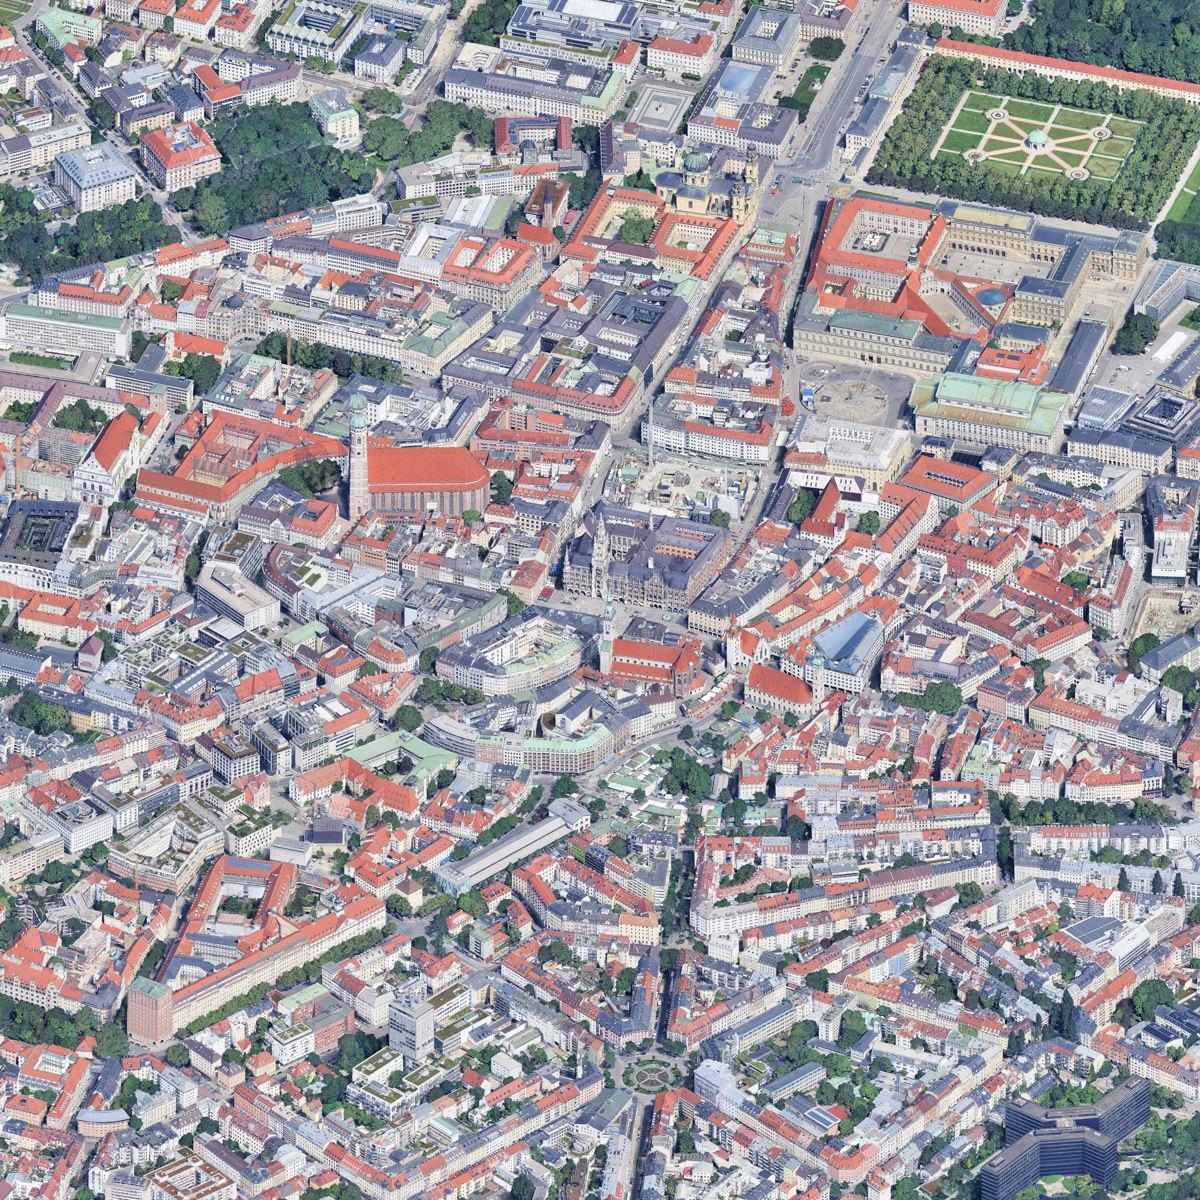
The raw capture: nine tiles of Google 3D Tiles, from the Hofgarten at the top to Gärtnerplatz at the bottom.
Painting it with Gemini
The raw capture is a photo, with all the usual problems of photogrammetry: melted edges, blurry trees, cars smeared over the streets and noise everywhere. The painting step is where it becomes a map. Andy fine-tuned his own model for this. For a pilot I wanted something faster, so I went directly to the Gemini API. My key already had access to several image models, among them gemini-3-pro-image (Nano Banana Pro) and the cheaper gemini-3.1-flash-image, and I picked the Pro one for quality.
The call itself is just a generateContent request with the prompt and the image as inline data, asking only for an image back. The prompt is where all the work goes. It has two halves: the style, and a long paragraph insisting that nothing may move:
Keep the exact same camera, framing and composition: every building, street, square, tree and landmark must stay in exactly the same position, size and shape as in the input. Do not add, remove or move anything. No text, no labels.
I tried two styles on the central tile, around 20 seconds per image. “Illustrated” asks for polished city-builder art, clean geometry, terracotta roof tiles, readable windows and fluffy stylised trees, close to Tiny València. “Pixel” asks for 1990s pixel art with dark outlines and dithering, closer to the New York map.
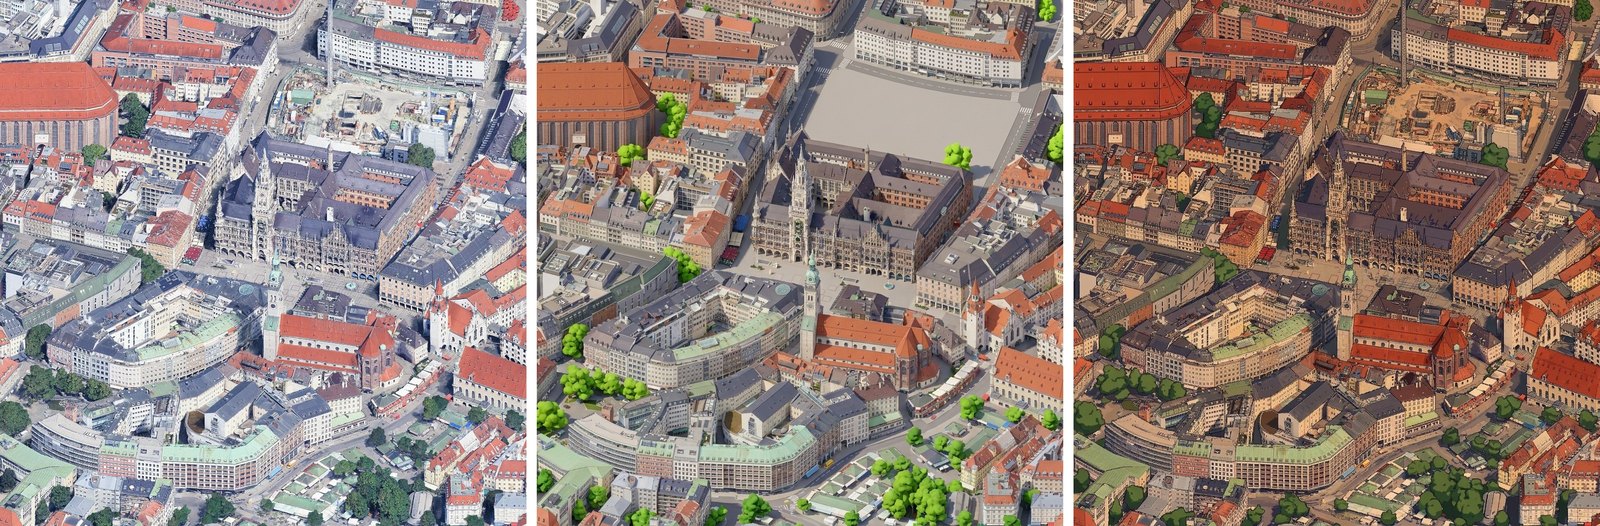
Left: Google capture. Centre: illustrated. Right: pixel.
The illustrated version won clearly. It is not perfect: the construction site next to the Neues Rathaus became an empty grey square, because the model decided that a building site does not belong in a nice picture. Everything else stayed in place, from the tower of St. Peter to the stalls of the Viktualienmarkt, which for a general purpose model I find impressive. The pixel version looked more like a comic than like real pixel art, and would need a lot more iterations on the prompt to get there.
The duplicated town hall
For the remaining eight tiles I did what looked reasonable: paint each one independently, and pass the already painted neighbours as a style reference, so the colours and the level of detail match. First the four tiles touching the centre, using the centre as reference, then the four corners, using their two painted neighbours. Each tile looked great on its own. Put together, it was a disaster.
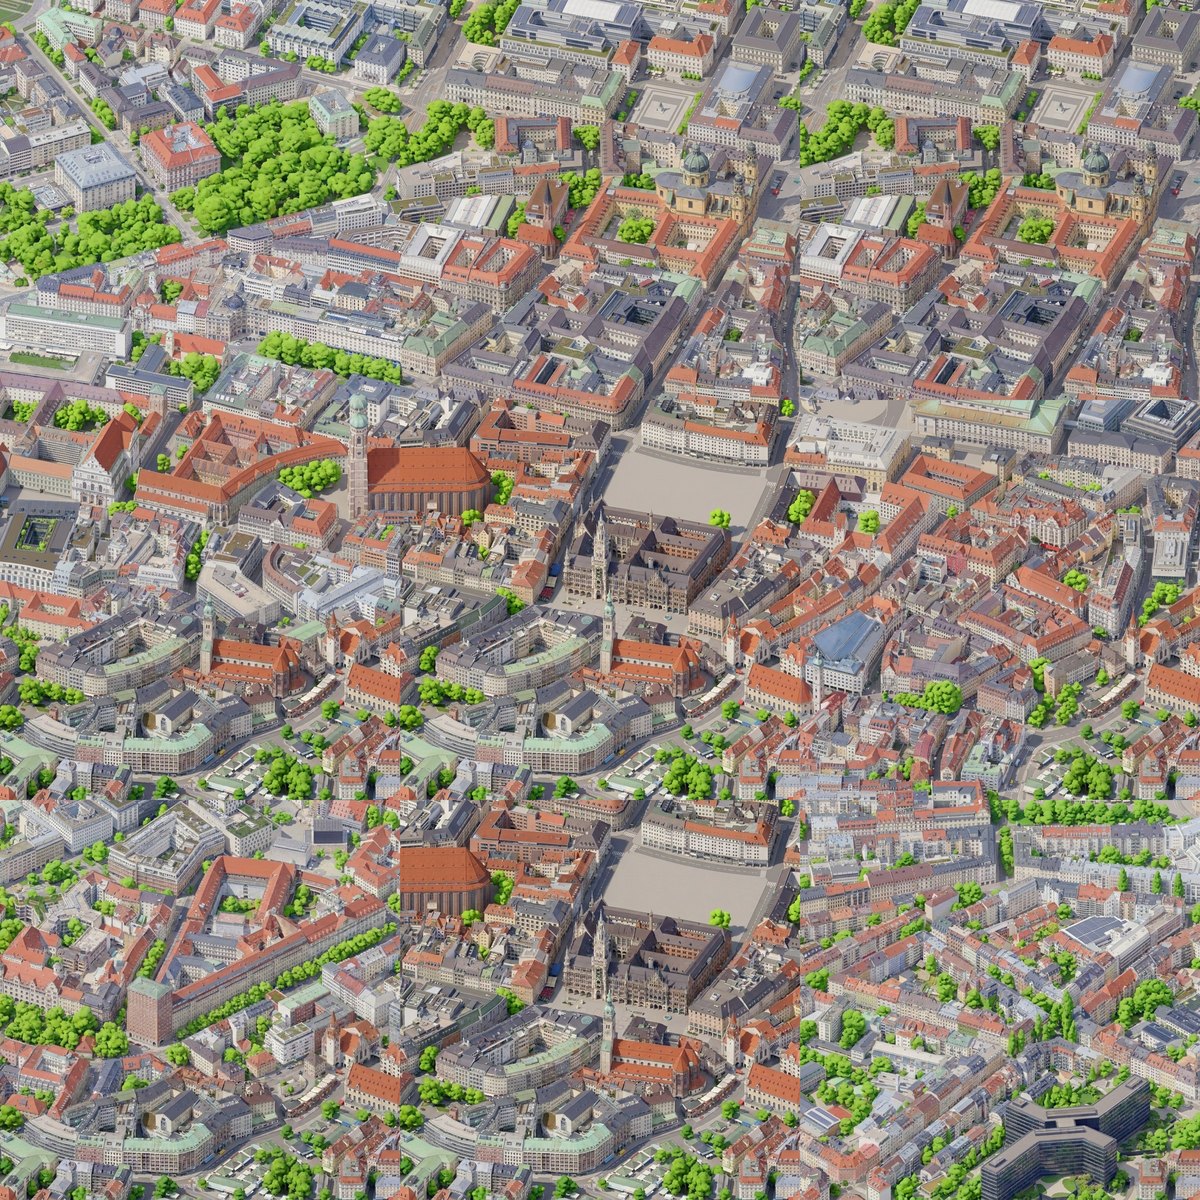
The first mosaic. Count the town halls.
The model did not use the neighbours as a reference for the style. It used them as a reference for the content. The tile below Marienplatz contains a second Neues Rathaus, the two tiles at the top contain the Theatinerkirche twice, and the borders between tiles do not match at all, because every tile was painted without knowing what was on the other side of its edge.
In retrospect it makes total sense. If you show an image model a picture and ask it for a picture, it will happily reuse whatever you gave it, and a written instruction saying “only for style” is a weak signal compared to the image itself. I did not lose much, around a dollar, but it changed how I think about prompting these models: the images you include are not context, they are material.
Infilling instead of referencing
The solution is the same trick Andy describes in his article: never show the model a separate reference, show it one single image where part of the content is already painted, and ask it to continue. I changed the pipeline to work with windows of 2 by 2 tiles, which is 2048 by 2048 pixels and one of the native output sizes of the model. Each window is a composite: painted pixels where they already exist, raw capture everywhere else. The prompt says that part of the image is already finished and the rest is still a photo, and asks to repaint the photo areas in exactly the same style, continuing across the boundary so no seam is visible.
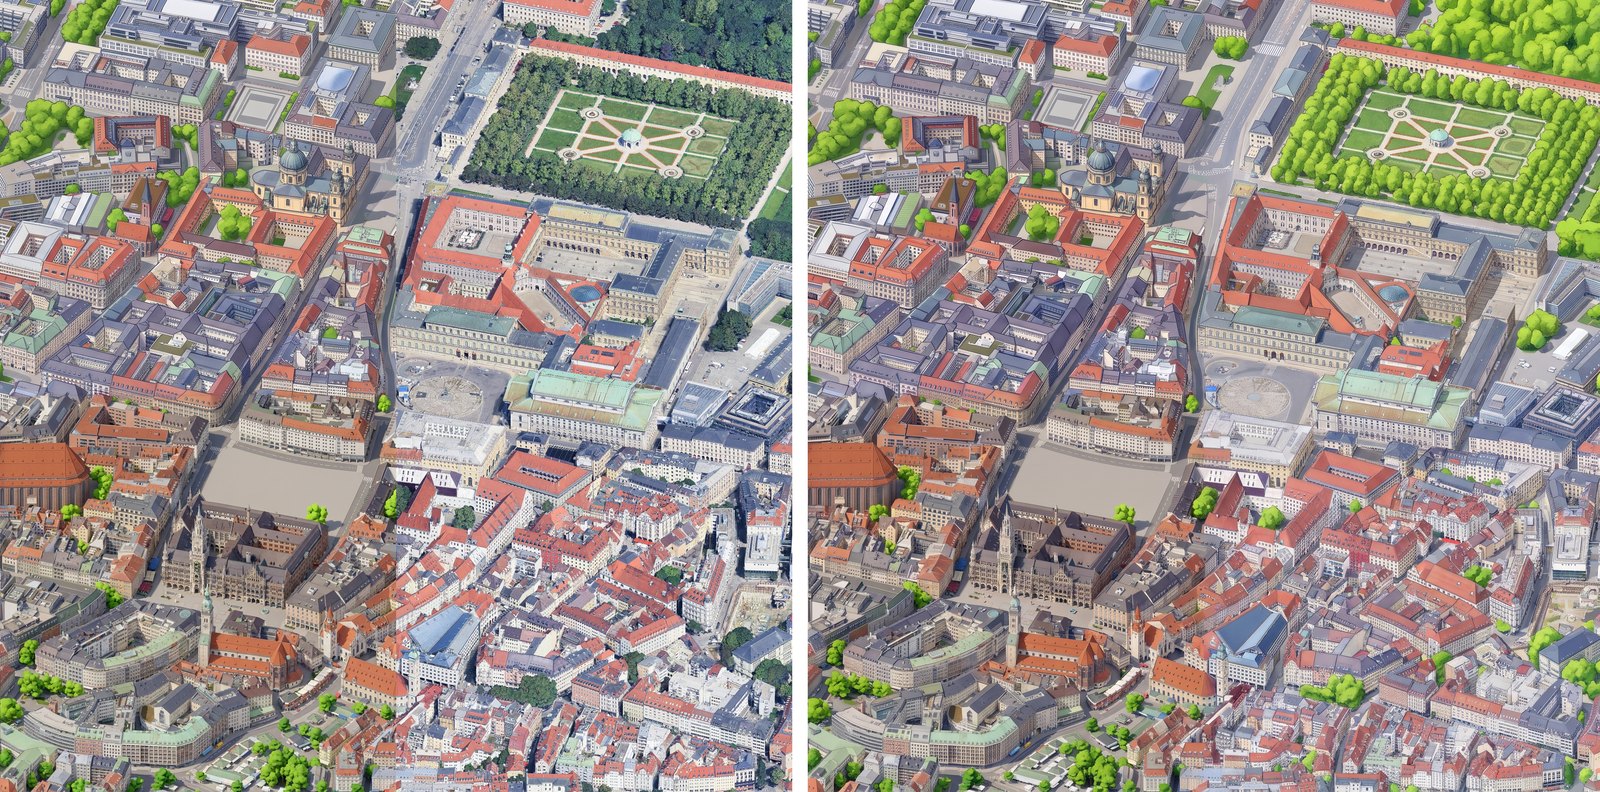
Left: what the model receives, with the painted tile on the left and the raw capture on the right. Right: what it returns.
The model repaints the whole window, including the parts that were already painted, and those come back slightly different. So from the output I only keep the area that was not painted before. To hide the join, the mask of the new area is grown and blurred by 24 pixels, so the new painting fades into the old one instead of meeting it at a hard line:
new = ImageChops.invert(mask.crop(box))
# Grow the new area a little into the old painting and soften it.
alpha = new.filter(ImageFilter.MaxFilter(25)).filter(ImageFilter.GaussianBlur(8))
merged = Image.composite(out, painted.crop(box), alpha)
painted.paste(merged, box[:2])
The order of the windows matters. First the top left window, which contains the painted centre and three raw tiles. Then the top right and the bottom left windows in parallel, because both can reuse what the first one painted. Finally the bottom right window, which already has painted content on two sides. Four calls of around 35 seconds each, instead of eight, and nothing to copy from.
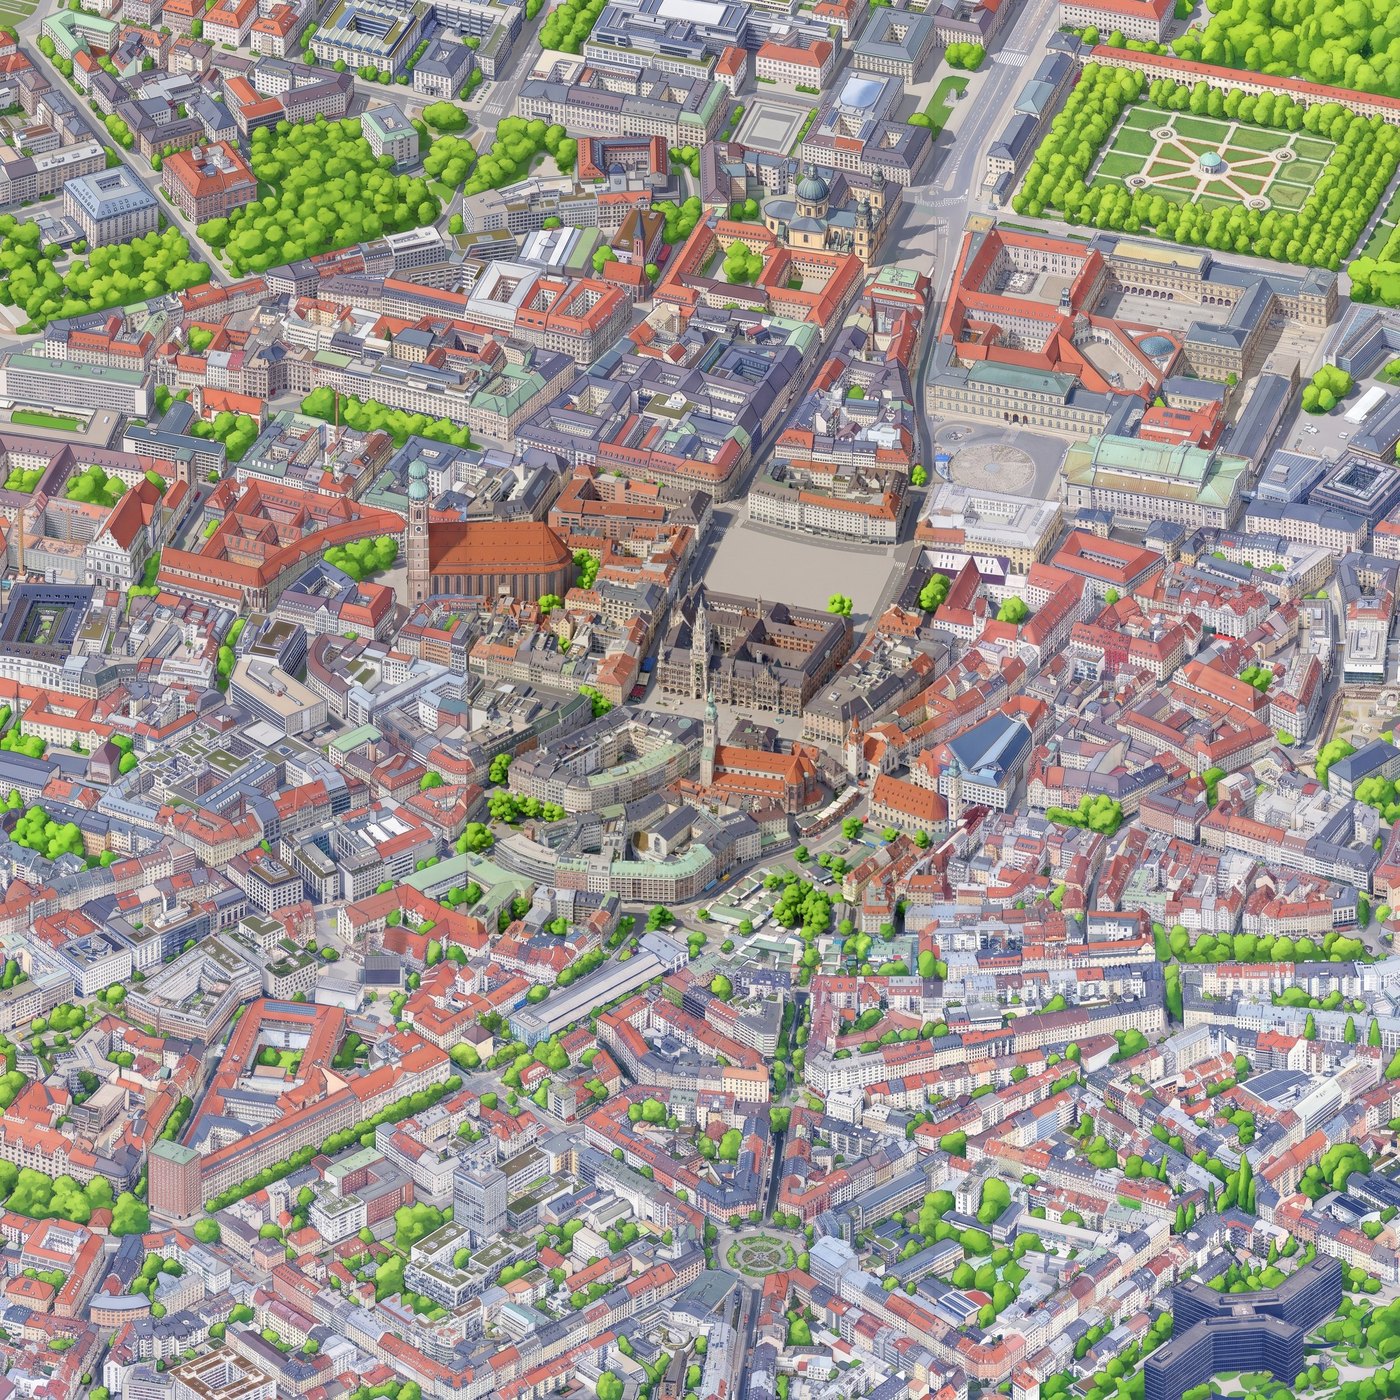
The final mosaic, with every landmark exactly once.
Every landmark is now where it belongs, exactly once: the Hofgarten with its little temple, the Residenz, the Theatinerkirche, the Frauenkirche, the Neues Rathaus, St. Peter and the roundabout of Gärtnerplatz at the bottom. There is one visible artefact left. The central tile, which was painted alone in the first round, is cleaner and more saturated than the ring around it, which came out a bit more like an ink drawing. For the full map everything will be painted with infill from the very beginning, starting from a single seed tile, so this should disappear.
Viewing it
A 3072 by 3072 pixel image is not something you want to send to a browser in one piece, and the full city centre would be more than ten times bigger. Same as isometric.nyc, the viewer uses OpenSeadragon.
OpenSeadragon reads the Deep Zoom format: an XML file with the size of the image, and a folder per zoom level with small square tiles. Level 0 is a single pixel, every level doubles the size of the previous one, and the last one is the image at full resolution. For 3072 pixels that is 13 levels. A small Python script with Pillow builds the pyramid with tiles of 256 pixels and one pixel of overlap, which is 6 MB of JPEGs for the pilot. The browser only downloads the tiles you are looking at, at the resolution you are looking at them, so the page loads instantly no matter how big the map gets.
The page itself is little more than OpenSeadragon with a minimap, four buttons and the mandatory “Imagery © Google” attribution. Most of the effort went into the pyramid, not into the page.
How much did it cost
Less than a coffee in Munich. This is the complete bill for the pilot:
- Google Map Tiles API: nothing. A few hundred tile requests fit easily in the free monthly quota.
- Gemini: around 2 dollars in total, including the two style tests and the failed first mosaic. An image of Nano Banana Pro costs around 13 cents, and the 2048 pixel windows did not cost more than the 1024 pixel tiles.
- Hosting: a static folder of a few MB, free in any static host.
The interesting number is what the full centre would cost. The area of the OpenStreetMap version, around 19 km², is roughly 200 tiles at this resolution. With windows of 2 by 2 tiles and a reasonable amount of retries, I estimate between 35 and 60 dollars with Nano Banana Pro. Going for the full city, like Tiny València, multiplies that by six. At that point the fine-tuning route becomes interesting: Andy mentions around 12 dollars for training and less than 3 dollars per hour of a rented H100, producing more than 200 images per hour. The real cost is not money anyway, it is the evenings you spend reviewing tiles. According to Andy, water and trees were the parts that failed most often, and the Isar is going to be a good test of that.
One practical note: the Gemini API returned a 402 error the first time, because my AI Studio project was still on the old postpay billing and had zero prepaid credit. If you see “Your prepayment credits are depleted”, you need to top up the project in AI Studio before anything works. Five euros were more than enough for everything in this article.
What I would do differently
Looking back, a few things would have saved me time:
- Start from the seed tile with infill. Painting the first tile alone and the rest with infill is what produced the difference of style in the centre. One seed tile, and every other tile with infill from the first minute.
- Decide the camera before anything else. Angle, orientation and scale define everything downstream: the captures, the prompts, the size of the windows. Changing any of them later means repainting, which is the expensive part. The interactive preview of the capture page was the best investment of the whole project.
- Keep every intermediate image. The infill script saves the composite it sends and the image it receives for every window. When something looks wrong in the mosaic, being able to see exactly what the model received is the fastest way to understand why.
Lessons learned
- OpenStreetMap is great for structure, not for texture. The procedural version took an evening, it is fully reproducible and it covers 19 km² instantly, but it will always look like a diagram.
- Do not give an image model anything you do not want to see in the output. Style references are content references.
- Infill solves consistency and seams at once. A composite of painted and unpainted pixels is the most effective prompt I have written for this project, and it does not even contain much text.
- Capture is cheap, painting is not. Re-rendering Google tiles costs only time, so get the camera right before spending a single cent on generation.
- Read the terms. Before publishing a map derived from Google’s imagery, check the terms of service of the Map Tiles API.
That last point is the next thing on my list, together with painting the rest of the Altstadt, the Isar and, if the budget allows it, the Englischer Garten. If it works, it will be very nice to have Munich next to New York and Valencia.
I write my thoughts about Software Engineering and life in general on my Mastodon account. If you have liked this article or if it did help you, feel free to share, 👏 it and/or leave a comment. This is the currency that fuels amateur writers.