


Predicting the usage of mobile OS with Google Trends
Planted March 15, 2013
Determining the usage of mobile operating systems is a crucial task to determine the movement of many businesses around the world. Depending on the growth of each platform, thousands of companies will change their decisions and business for a year.
The usage is mainly tracked by measurement and information companies such as Nielsen, Gartner or Canalys. Their methodology, as in many different surveys, consists of combining interviews and statistical data from the companies (e.g., sold phones) and Internet tracking information (i.e., by requesting the “user agents” collected by an Internet server, the percentage corresponding to a particular operating system might be determined). However, there are always problems in this methodology: as a very simple and extreme example, most of the devices accessing google.com will be either Android or WPhone, since WPhone promotes its own search engine Bing; however, the number of WPhone users will be extremely low compared with its real number).
Connecting this with the second part of the article, Google has become the primary means of finding information on the net. Each query entered within the search engine is stored, and is afterwards available to the general public through its Website, Google Trends. There are some interesting stories from Google Trends. Google has its own website that tracks the spread of influenza in different regions and countries, for example. In some other scenarios, the prediction might not be as accurate, as seen in the prediction of the U.S. Congressional elections. This data has an obvious connection with business analysis. Let’s say, what if AirBnb considers getting a full report of searches matching the term sublet before deciding where to deploy its service next? The number of examples is huge.
Now, how similar are the results dropped by survey companies and Google Trends? Let’s see some results from survey companies corresponding to the usage of mobile platforms during this year:
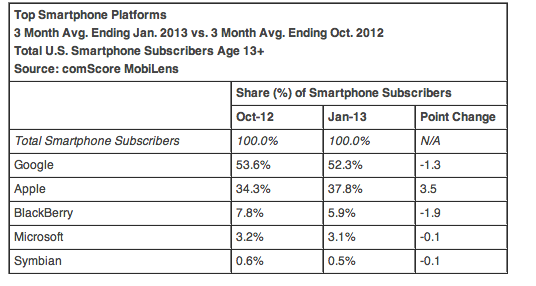
Comscore report (USA only)
Mobile OS Market Share as of February 2013 Net Applications
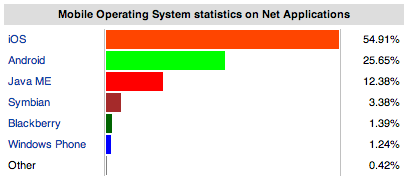
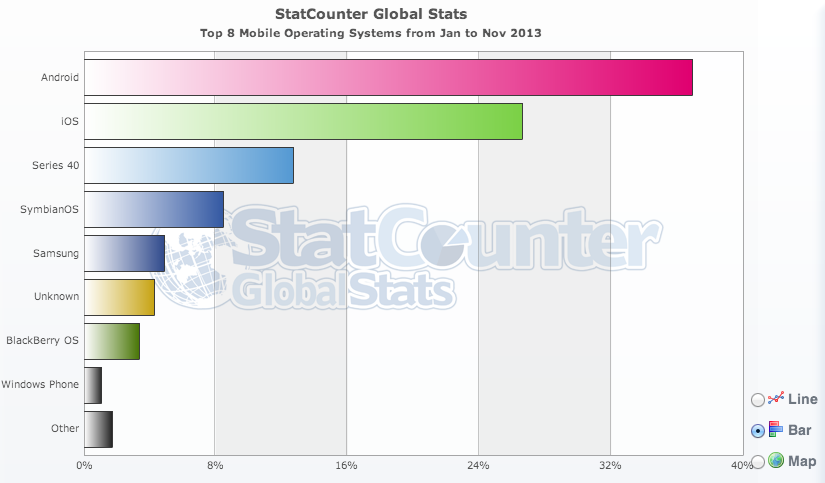
There are some significant differences. While StatCounter and Comscore are showing similar results for the order of the most relevant and used brands, their percentages vary significantly (and even Symbian appears as the fourth most used Mobile OS with more than 8% of market share). On the other hand, the result of Net Applications varies completely from their rivals: iOS appears as the most used OS with more than 50% of the global users, and Java ME appears even with more than 12% of the global users.
Analyzing the same results with Google Trends: For the comparison, I have used the terms “android”, “iphone”, “windows phone” and “blackberry”. Other terms such as “symbian” or “webos” do not appear to have any significance, so I decided to remove them from the comparison. This is the table that shows the comparison between all the different operating systems.
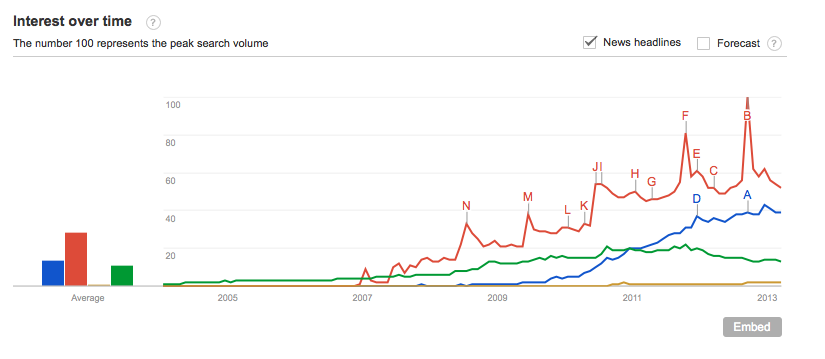
The peaks, highlighted with letters, show some of the major events related to each term (for instance A represents the launch of iPhone 5). This table can be generated at the following link.
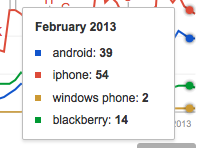
According to the percentages shown above, we will have the following percentages for each platform:
- Android: 39/109 = 35,77%
- iPhone: 54/109 = 49,54%
- Windows Phone: 2/109 = 1,8%
- Blackberry: 14/109 = 12,8%
Although they vary from the previous surveys, there are some common elements:
- As in the survey from Net Applications, iOS leads the OS market with a percentage close to 50%.
- Android is the second direct competitor.
- Blackberry has more presence using Google Trends as in the other surveys, and Windows Phone has an ephemeral presence.
Some points that might lead to improving the results using Google Trends:
- Some terms might diverge or converge between operating system and manufacturers. For instance, "samsung", "htc" might be terms referring to Android, but also to different news regarding their manufacturers. "iOS" might refer to the operating system of iPhone.
- Some of the terms might have an overrepresentation. For example, it is well known that the evolution of BlackBerry market has been quite negative. Most of the terms referring to BlackBerry might be talking about the decadence of the platform. Ironically, this presence of the term on the Internet gives more representation to the term BlackBerry than it really deserves.
- Apple has a well-known reputation for its marketing and merchandising. This might lead as well to an overrepresentation of iPhone devices using this technique.
- Tablets are not within the focus of this graphic, but it might be extended to other terms such as "iPad", "honeycomb" or similar terms.
Enrique López-Mañas